In this age, data analysis is a crucial process and it’s important for us to know the fundamental aspects of such analysis. Much of such statistical analysis can be broken down into basic concepts of mean, standard deviation and similar parameters. In this article, we will cover some very basic topics and learn how to do statistical comparison of two data sets in Excel.
📁 Download Practice Workbook
Download the practice workbook below.
Overview of Some Statistical Terms
Here, we would like to discuss some statistical terms such as Arithmetic Mean, Standard Deviation, and Coefficient of Variation.
Arithmetic Mean
The Arithmetic Mean or Mean is the sum of a collection of numbers or data divided by the count of data or numbers in the collection. This statistical term can provide an idea about the central tendency in a range of data but for skewed distributions, the mean does not clearly indicate the central tendency. For such cases, Median can be used as a measure.
Standard Deviation
Standard Deviation is a term that measures the deviation or dispersion of a dataset corresponding to its average value. When the individual data are more far away from the mean, the standard deviation is more in that case. Standard deviation is equivalent to the square root of Variance.
Coefficient of Variation
The Coefficient of Variation can be determined by the ratio of Standard Deviation to Mean. It expresses the variability with respect to the average of Mean value. We can also term it as relative standard deviation. We generally express it as a percentage value.
Range
In statistics, range means the difference between the highest value and the lowest value in a given set of data. When the maximum and minimum values of the sample can be identified, their difference will give us the range of that dataset.
Learn to Do Statistical Comparison of Two Data Sets in Excel with These 5 Suitable Steps
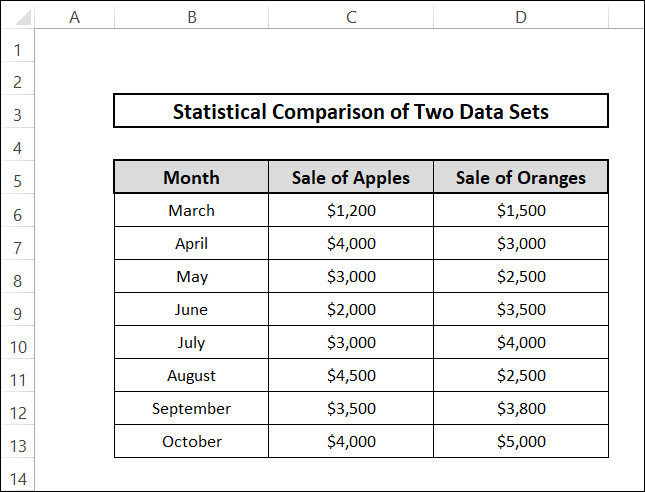
To demonstrate statistical comparison between two data sets, we consider a dataset where the sales of two types of fruits, such as apple and orange based on different months are presented. Using this data, we will find some common statistical terms for the two types of fruits and then compare the results accordingly. The dataset is shown as follows:
We will be calculating four statistical terms in this article. These are Arithmetic Mean, Standard Deviation, Coefficient of Variation and Range. To do so, we will follow these steps:
Step 1: Calculating Mean Values
- At first, we will calculate the statistical terms for the sales of apple. We select cell C15 at first.
- Then, we go to the formula bar and write the following formula to calculate the Mean value using AVERAGE function and then press Enter.
=AVERAGE(C6:C13)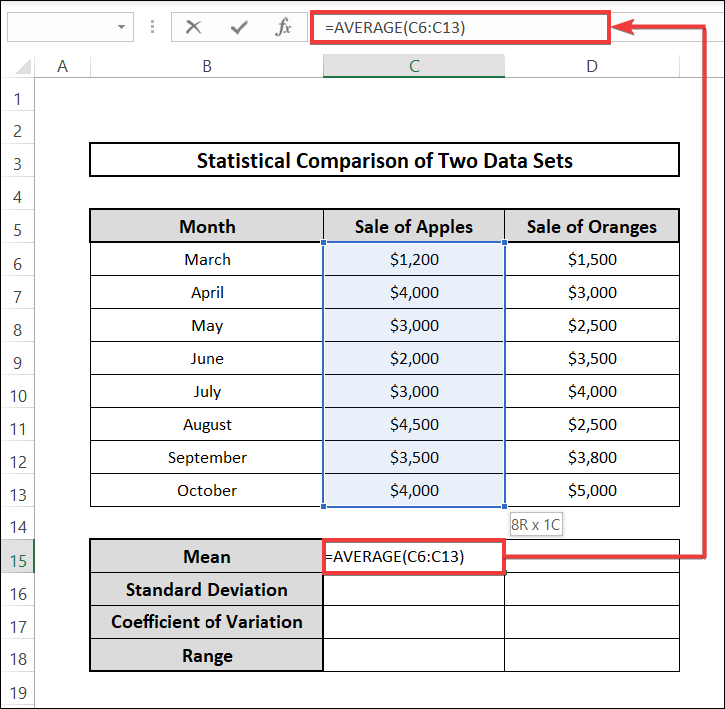
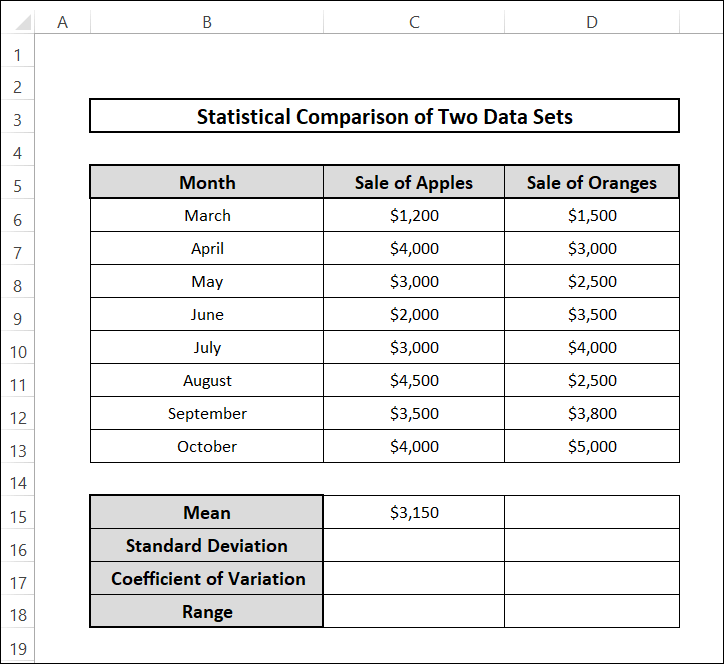
- The average value will be visible like the following image.
📕 Read More: 6 Easy Methods to Compare Two Strings in Excel for Similarity
Step 2: Finding Standard Deviation
- We select the cell C16 and write down the following formula in the formula bar to calculate Standard Deviation using STDEV.S function.
=STDEV.S(C6:C13)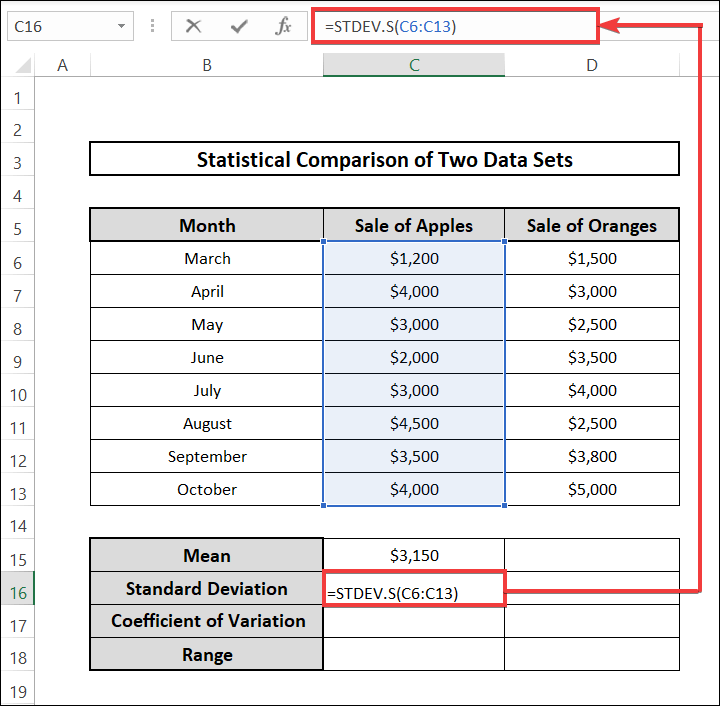
- Then we press Enter. The result will look like the following image.

Step 3: Determining Coefficient of Variation
- We select cell C17 to calculate the Coefficient of Variation. We write the following formula in the formula bar.
=C16/C15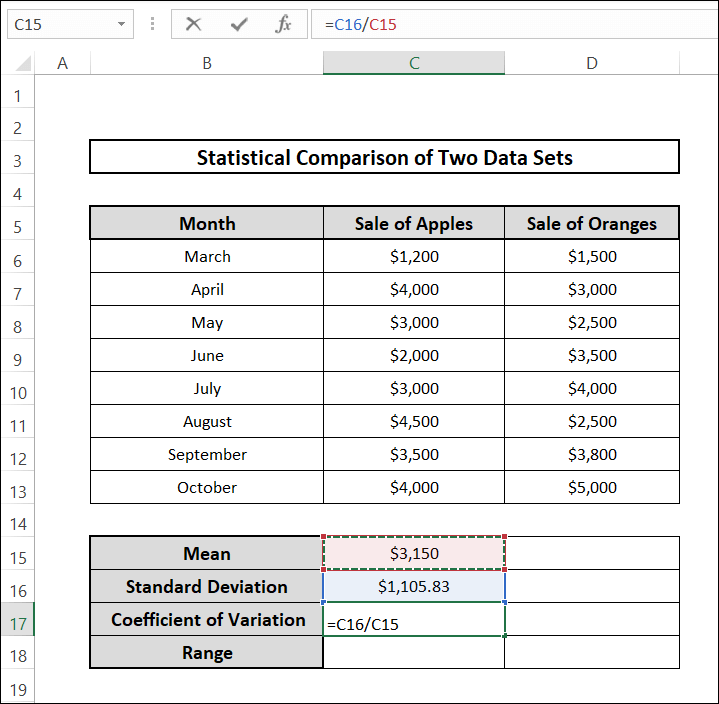
- Then we press Enter. Then we have to convert it into percentage value. We select the cell and go to Home and then from the Number section in the Ribbon, we select the % sign.
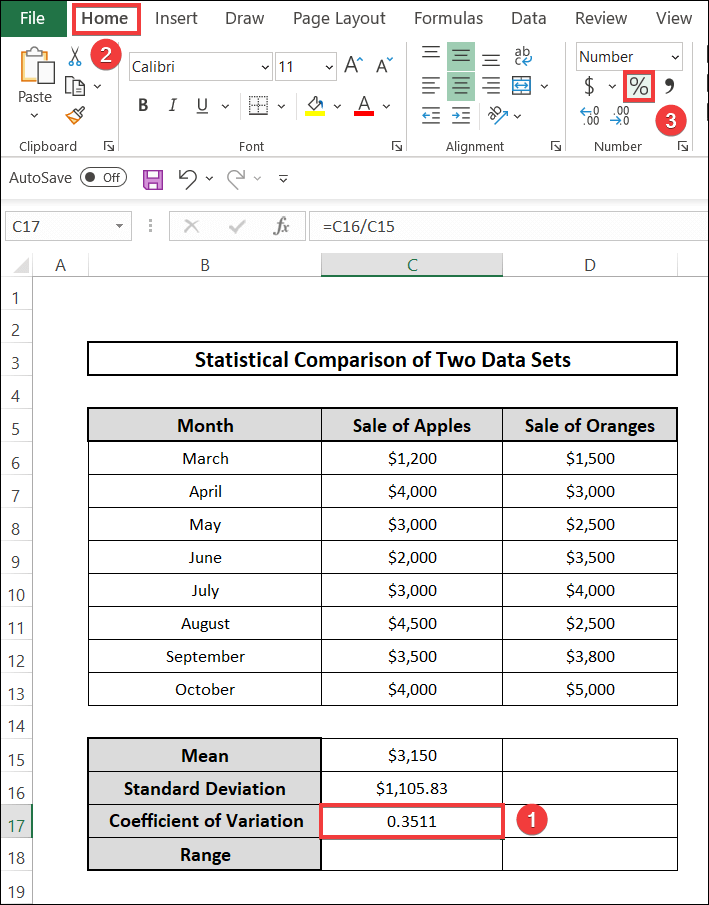
- The result will come out like the image below.To get an accurate estimation, we select the decimal sign in the Number section to get two digit accurate values for the Coefficient of Variation.
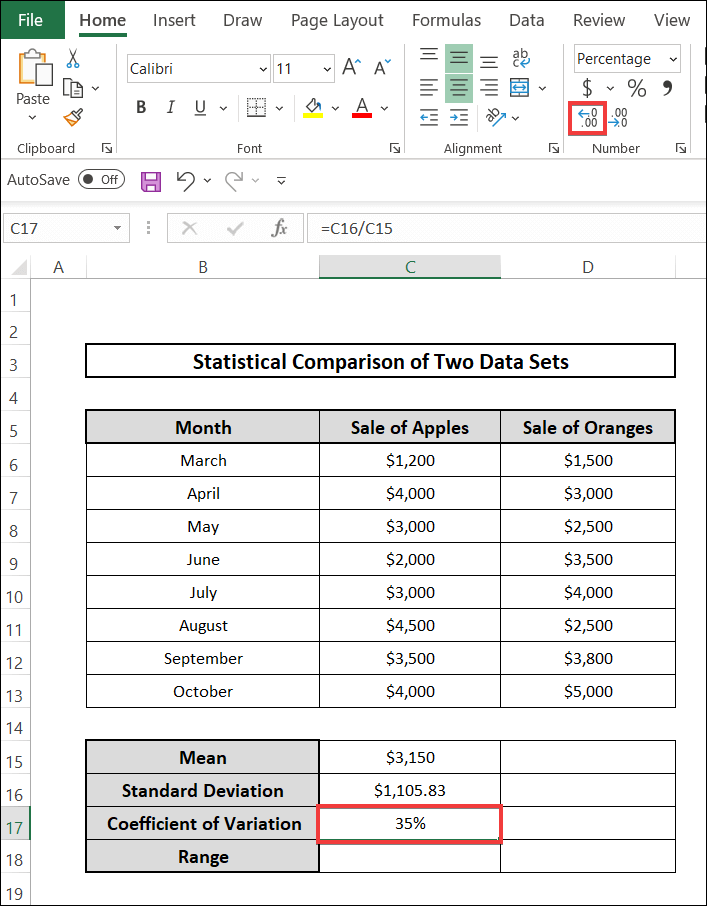
- The final outcome will be like the image below.

Step 4: Calculating Range
- As a final step, we select the cell C18 similarly and write the following formula in the formula bar to calculate the range using MAX and MIN functions.
=MAX(C6:C13)-MIN(C6:C13)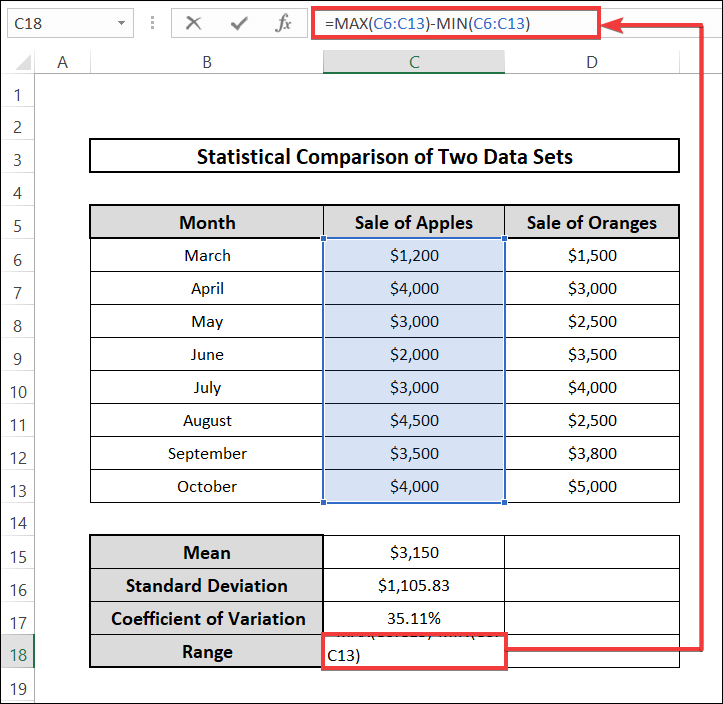
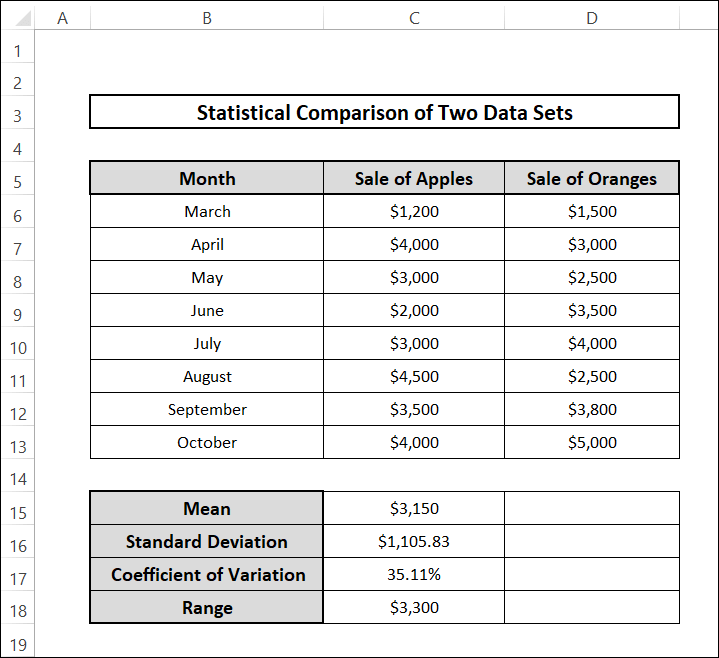
- After that, we press Enter. The statistical terms for the sales of apple will be visible like the following image.
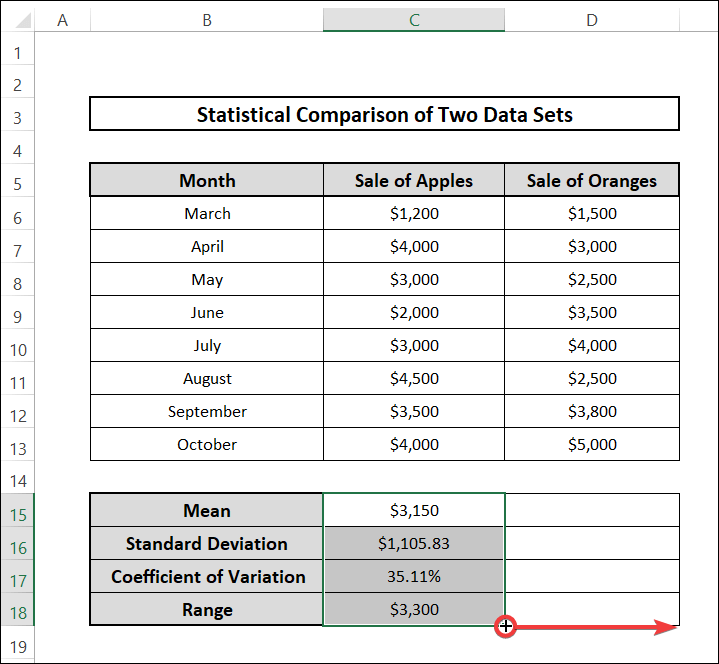
- Now, we will be repeating the same process for the sale of oranges. We select the cells C15:C18 and then select the Fill Handle at the bottom right of cell C18 and drag it right towards the cell D18.
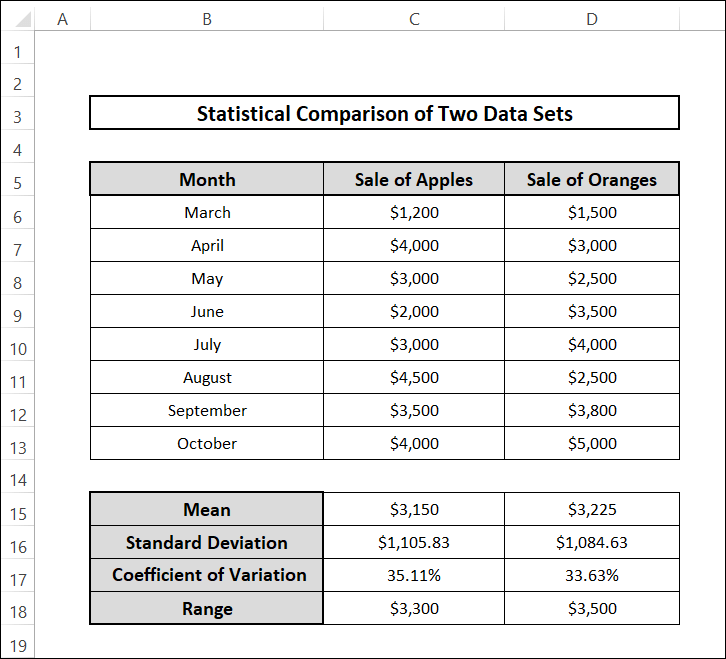
- The formulas will be copied relatively for the D column and we will get the output for orange sale similar to the following image.
Step 5: Establishing Comparison Between Two Data Sets
We can compare the two dataset values with the statistical terms as well as through individual monthly values. For initial comparison, we generate a graph with the data from the table. To compare the data sets, we follow these steps.
- We select the cells B6:D13.
- Then we go to Insert and then select More statistical chart from the Insert Statistical Chart present in Charts section of the Ribbon.
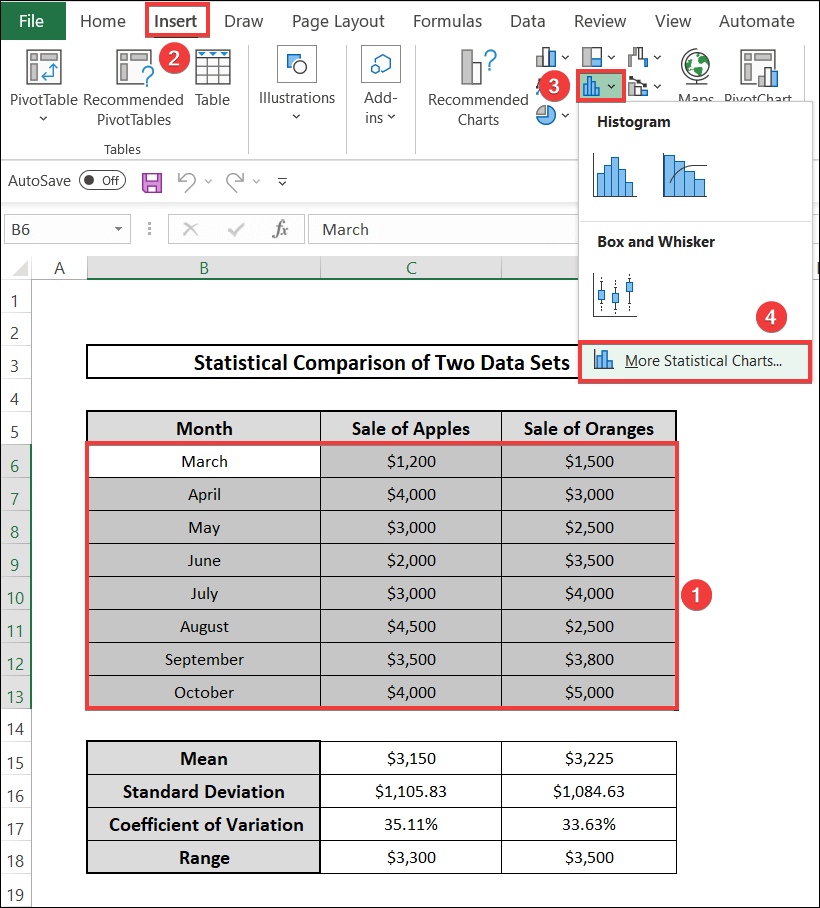
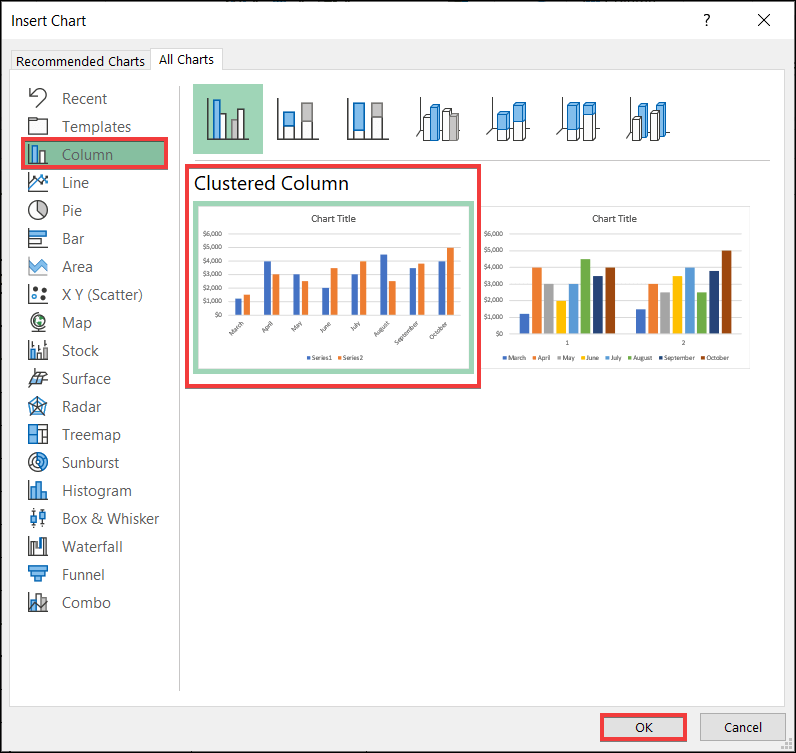
- A popup window will appear. We can select the chart types from this box. We select Column and select the first type of chart.

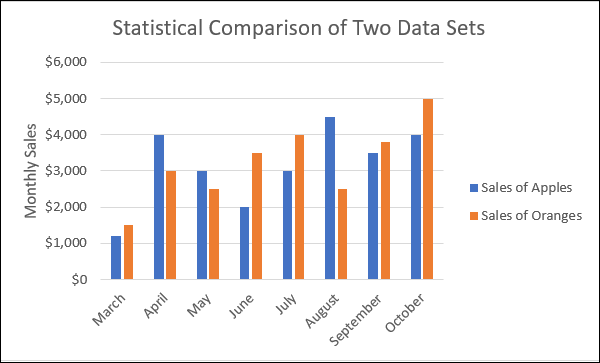
- A bar diagram will be revealed with the data we specified. We rename the axes and series. The final chart will look like the following image that gives us a graphical comparison of the raw data.
- Now we will compare the statistical terms. For this, we select the cells B15:D18. After that, we follow the same procedure. From the Insert Statistical Chart option found in the Charts area of the Ribbon, we choose More statistical chart.
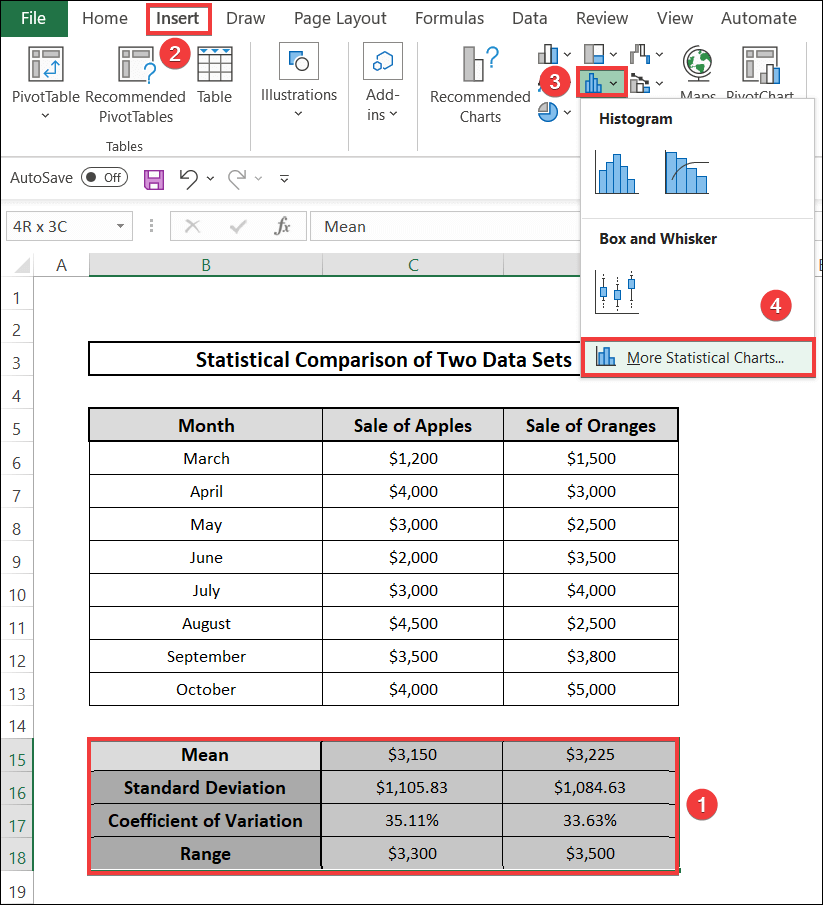
- From the newly popped-up window, we select the column and then pick the first chart type.
- A bar diagram will reveal showing the comparisons in a bar chart. We modify the axes and section afterward. The final comparison graph will be like the following image.
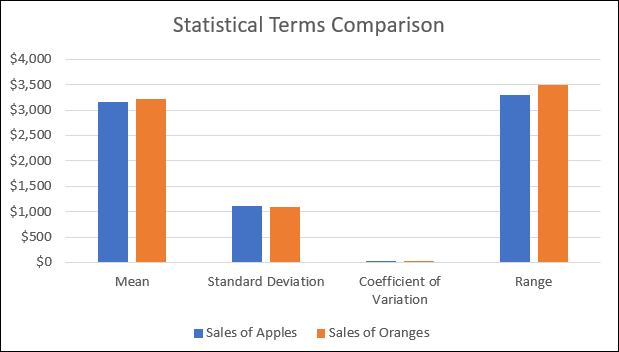
- From the graph, we can observe that the Mean and the Range value for the sale of apples is more than that of orange. On the other hand, the Standard Deviation and Coefficient of Variation for the sale of apples is larger than that of the sale of oranges.
📄 Important Notes
🖊️ We should take note to express the Coefficient of Variation as a percentage value.
🖊️ To edit the series names in the generated chart, we have to go to the Select Data option under the Chart Filters option.
📝 Takeaways from This Article
You have taken the following summed-up inputs from the article:
📌 One can easily find out the Mean, Standard Deviation, Coefficient of Variation, Range and other statistical terms by using simple inbuilt formulas in Excel.
📌 We can do a comparison of two datasets by comparing the numbers and also by representing them in graphs.
Conclusion
In conclusion, I hope that this article has provided you with insights about how we can do a statistical comparison between two data sets in Excel. If you want to know more about Excel, please visit our site ExcelDen and if you have any queries regarding this topic, feel free to let us know down below in the comment section.
Related Articles
- How to Compare Two Cells in Different Sheets with Excel Formula
- 11 Approaches to Compare Addresses in Excel